
The Prevent Blindness Children’s Vision Health Map is the first-of-its-kind interactive map of visual acuity loss and eye care among children in U.S. counties and states. The map is helpful for understanding county- and state-level characteristics that may impact children’s vision and eye health conditions and outcomes, and for developing systems, policies, and practices to support stronger supports for children for early detection and treatment of visual acuity loss.
Viewers can explore relationships between children’s vision disorders and impairment or receipt of eyeglasses to community demographics (such as race/ethnicity, income, disability status); health system factors (distribution of eye care providers); educational outcomes (reading and math scores); and the existence of regulations for vision screening (for preschool and school-age children). The Children’s Vision Health Map is accompanied by a comprehensive report with more detail, state comparisons, and guidance in using the map. The data on children’s vision and eye care was generated by the Centers for Disease Control and Prevention’s Vision and Eye Health Surveillance System (VEHSS).
Over 600,000 children in the United States are living with uncorrectable visual acuity loss or blindness, and millions more experience vision problems from uncorrected acuity problems that could be easily resolved with glasses or contact lenses. In this report, we describe the case definitions, methods, and data sources used to create the Prevent Blindness Children’s Vision Health Map, the first ever online interactive system specifically designed to explore geographic variations in common children’s vision problems.
Key Findings from The Prevent Blindness Children’s Vision Health report:
*The Children’s Health Insurance Program (CHIP) provides health coverage to eligible children through both Medicaid and separate CHIP programs. Children eligible for CHIP are in families with incomes too high to qualify for Medicaid, but too low to afford private coverage. CHIP is managed by states according to federal requirements and is funded by states and the federal government.
Using the Prevent Blindness Children’s Vision Health Map
This Prevent Blindness Children’s Vision Health Map provides a simple and intuitive way to explore the data presented in this report at the state or county level. This section demonstrates some of the key features and functionality of the map. Note that all of the outcome data included in the Children’s Vision Health Map are also available on the VEHSS website. However, VEHSS does not include bivariate relationship mapping.
Dropdown Menus
Use the dropdown menus on the left side of the map to make any changes in the selected geography, outcome measures, filters, indicators or relationships.
Note that you must click the Update Map button to load a new map with your selections.

Use this dropdown menu, then click Update Map to switch between State and County views.

Indicate States With Vision Screening Legislation
Use this dropdown, then click Update Map to add dots that will indicate which states have child vision screening legislation in 2024.

Filter By Subtopics
Use these dropdown menus to change the “base layer” data shown on the map.
Select Outcome Measure
The Outcome Measures are the main results of the Child Vision Health Map, including
- Vision Loss and Blindness which reports the prevalence of vision loss among all children in the United States,
- Amblyopia and Strabismus which reports diagnosis rates among children in Medicaid, and
- Vision Correction, which reports the proportion of children in Medicaid who received Medicaid-covered eyeglasses

Age Group, Race/Ethnicity, Gender
Selecting values in these dropdowns will filter the demographic groups displayed in the base- layer Outcome Measures. For example, if the selected outcome measure is ‘Any Visual Acuity Loss’, then selecting Age 0-11, Hispanic, and Male, then clicking ‘Update Map’ will reload the map showing the prevalence rates of ‘Any Visual Acuity Loss’ among 0–11 year-old Hispanic boys.

Add Relationship
What are the relationship variables?
The relationship variables are community (state or county) level data for factors that may be correlated with the outcome measures. An important point is that these variables are NOT measured among the children affected by the outcome measure – these are community level indicators measured among the entire population of the area. For example, Math Scores are a measure of the math scores for all students in the state or county. They are NOT the math scores among children with vision or eye problems. Currently, such data does not exist. The intent of the relationship variables is to facilitate users’ understanding of how community characteristics may be associated with vision and eye problems, diagnosis and treatment. The selection of these variables are based on expert opinion and published literature on social determinants of health and their associations with vision problems. Currently, there is little or no evidence on causal links between these variables and the vision and eye problems reported in this map.

Bivariate Map Mode
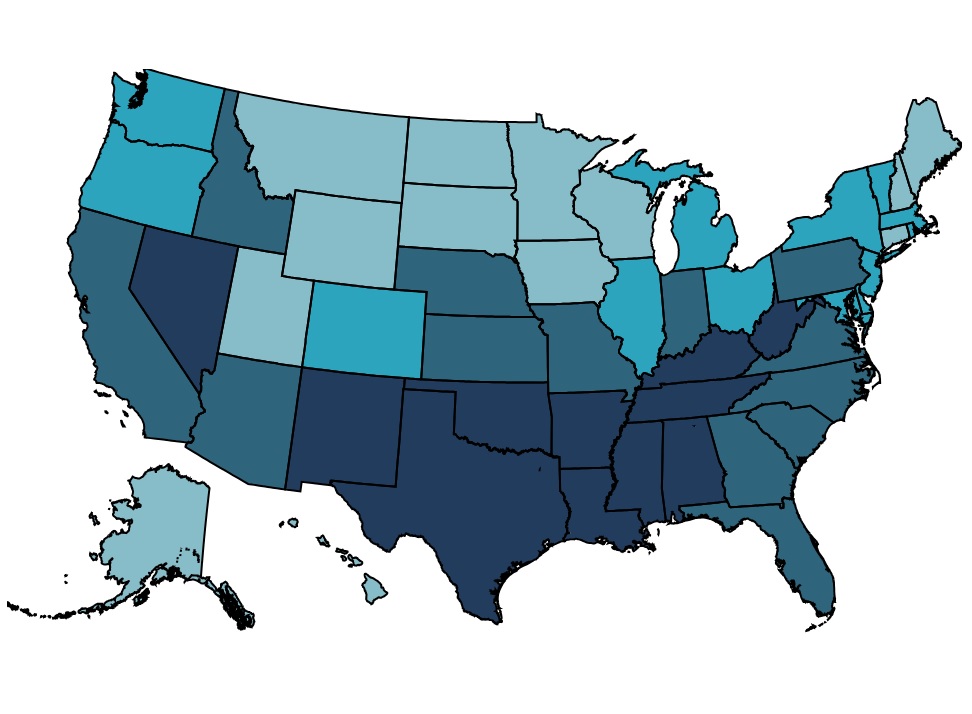
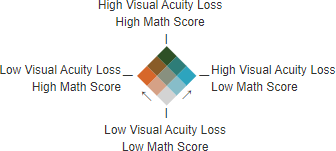
Selecting a relationship variable and clicking ‘Update Map’, will load the map in bivariate mode, which displays 2 variables each with its own color scale. The base layer is in blue, but the relationship variable is in orange. When both the base layer value and the relationship variable value are high, the blue and orange combine and turn green.
This image shows the bivariate map legend showing the combination of both color scales. In this example, the base layer is showing visual acuity loss in blue, where a darker blue indicates higher prevalence of visual acuity loss. The relationship variable selected is Math Scores shown in orange, where higher math scores are darker orange.
This image shows a small section of the map with these selections:
- The blue (1) counties in the west are areas with both high visual acuity loss prevalence and low math scores.
- The orange (2) counties in the east are areas where the prevalence of visual acuity loss is low and math scores are high.
- The green (3) county in the center has both high visual acuity loss and high math scores.
- The light orange (4), light blue (5), teal (6), and brown (7) counties are areas where one or both variables are above or below average.
- The dark gray (8) counties in the center are average in both visual acuity loss and math scores.
- The light gray (9) county in the south has low visual acuity loss and low math scores.

Vision Loss
The vision loss prevalence estimates are from the CDC’s Vision and Eye Health Surveillance System’s ‘VEHSS Prevalence Estimates: Visual Acuity Loss’. The VEHSS Prevalence Estimates are generated using a statistical modeling approach called Bayesian meta-regression, which researchers used to combine information from multiple VEHSS data sources into a single summary estimate.
The ‘VEHSS Prevalence Estimates: Visual Acuity Loss’ use measured visual acuity data from the National Health and Nutrition Examination Survey (NHANES) as the reference point dataset to create output based on the characteristics and performance of the NHANES vision exam. In addition to NHANES, the estimation model used population-based study data to provide additional evidence, and self-reported survey data to provide information on variation by state, county, and among under-represented population groups.
Documentation
Explore the Data
All data included in the PUF file can be displayed and analyzed in the VEHSS Data Explorer interactive data visualization application.
Select ‘Vision Problems and Blindness’ > ‘Vision Loss and Blindness’ > ‘VEHSS Prevalence Estimate: Visual Acuity Loss’
Access the Data
All vision loss data presented in this report and on the Prevent Blindness Children’s Vision Health Map are from the VEHSS Prevalence Estimates public use file (PUF). This PUF is freely available for download from the CDC’s VEHSS Data Portal, which allows users to query, visualize, and access PUFs via download or through direct application programming interface (API).
Citations
Flaxman AD, Wittenborn JS, Robalik T, Gulia R, Gerzoff RB, Lundeen EA, Saaddine J, Rein DB. Prevalence of visual acuity loss or blindness in the US. JAMA Ophthalmology. 2021;139(7):171-23.
Lundeen EA, Flaxman AD, Wittenborn JS, et al. County-Level Variation in the Prevalence of Visual Acuity Loss or Blindness in the US. JAMA Ophthalmology. July 7, 2022: doi:10.1001/jamaophthalmol.2022.2405.
Amblyopia, Strabismus, and Eyeglasses
Diagnosed prevalence of amblyopia and strabismus, and provision of eyeglasses measures included in the Prevent Blindness Children’s Vision Health Map come from CDC’s Vision and Eye Health Surveillance System (VEHSS) analysis of the Medicaid Transformed Medicaid Statistical Information System (T-MSIS) data. T-MSIS data are a set of de-identified person-level data files with information on enrollment, eligibility, service utilization, diagnoses, and payments in Medicaid and Children’s Health Insurance Program (CHIP). Owned by the Centers for Medicare & Medicaid Services (CMS), Medicaid data cover everyone enrolled in Medicaid and CHIP from participating states within a given year.
Certain beneficiaries were excluded from the analysis, including beneficiaries 1) who are dually enrolled in Medicare, 2) without a valid gender variable, 3) do not have a valid care plan variable, 4) are only enrolled in single-service plans (i.e., a dental plan), 5) have missing enrollment information, or 5) are duplicates based on beneficiary, plan, and state ID’s. Based on these exclusion criteria, 34,094,900 Medicaid/CHIP beneficiaries aged younger than 18 were included in the analysis.
Four states (Alabama, Alaska, Utah, and Vermont) were not included in the results because they were either not included in T-MSIS base file, or because data quality issues preclude them from the analysis.
Documentation
A summary of the VEHSS Medicaid data analysis
Explore the Data
All vision loss data presented in this report and on the Prevent Blindness Children’s Vision Health Map can be displayed and analyzed in the VEHSS Data Explorer interactive data visualization application.
Filter the data sources to ‘Medicaid’ to explore all vision and eye health indicators included in the VEHSS analysis of Medicaid data.
Access the Data
All vision loss data presented in this report and on the Prevent Blindness Children’s Vision Health Map are from the VEHSS Medicaid public use file (PUF).
This PUF is freely available for download from the CDC’s VEHSS Data Portal, which allows users to query, visualize, and access PUFs via download or through direct application programming interface (API).
Math and Reading Scores
The state and county-level Math Score and Reading Score data are from the Educational Opportunity Project at Stanford University. This project seeks to produce estimates of student performance that are comparable across states. The data are based on state testing from grades 3-8 by standardizing proficiency thresholds across different types of tests in different states.
Documentation
A summary of the SEDA data and methods
Explore the Data
The SEDA Educational Opportunity Explorer is an interactive online visualization application that can display the math score, reading score, and other data.
Access the Data
Public use files are available by request.
Citation
Reardon, S. F., Ho, A. D., Shear, B. R., Fahle, E. M., Kalogrides, D., Saliba, J. (2024). Stanford Education Data Archive (Version 5.0). Retrieved from https://purl.stanford.edu/cs829jn7849
Prevalence of Hearing Loss
The prevalence of hearing loss is based on data from NORC’s SoundCheck project. SoundCheck uses statistical modelling approaches to combine examination, survey, and administrative claims-based data to produce comprehensive estimates of the prevalence of hearing loss at the national, state and county level.
Documentation
Documentation is available through the SoundCheck ‘National Indicator Report on Hearing Loss’ report
Explore the Data
The soundcheckmap.org website contains an interactive map to display the hearing loss prevalence data.
Access the Data
Citation
Rein DB, Franco C, Reed NS, Herring-Nathan ER, Lamuda PA, Alfaro Hudak KM, Hu W, Hartzman AJ, White KR, Wittenborn JS. The prevalence of bilateral hearing loss in the United States in 2019: a small area estimation modelling approach for obtaining national, state, and county level estimates by demographic subgroup. Lancet Reg Health Am. 2024 Jan 24;30:100670. doi: 10.1016/j.lana.2023.100670.
Prevalence of cognitive difficulties, uninsured rate, poverty rate, low English-speaking proficiency, Income inequality
The prevalence of cognitive disabilities cognitive difficulties, uninsured rate, poverty rate, low English-speaking proficiency are based on 2022 American Community Survey (ACS) data.
• Cognitive difficulties are based on responses to the question: “Because of a physical, mental, or emotional problem, does the respondent have difficulty remembering, concentrating, or making decisions?” from table B18104 from 2022 ACS 5-year data.
• The Uninsured rate was calculated as the proportion of children in the location who were reported to lack health insurance, sourced from table B27001 from 2022 ACS 5-year data.
• The Poverty rate was calculated as the proportion of households in the location who reported annual household income below the poverty rate, sourced from table S1701 from 2022 ACS 5-year data.
• Low English-speaking proficiency was calculated as the percent of population who speak English less than “very well”. English proficiency data is sourced from table C16001 from 2022 ACS 5-year data.
• Income inequality is based on the GINI index, which is a coefficient value reported in table B19083 from 2022 ACS that summarizes the dispersion of household income, and ranges from 0 (perfect income equality) to 1 (perfect income inequality).
Eyecare Providers Per Capita
The eyecare providers per capita were calculated by analyzing the National Provider Index (NPI) produced by the National Plan and Provider Enumeration System (NPPES), part of the Centers for Medicare and Medicaid Services (CMS). The NPI contains the street address and provider type taxonomy codes for all healthcare providers who have registered to submit for reimbursement from CMS.
In our analysis, we used the provider type taxonomy codes to identify providers and categorize them into the following groups:
- Any eyecare provider
- Ophthalmologists
- Pediatric Ophthalmologists
- Optometrists
- Pediatric Optometrists
Of note, pediatric ophthalmologists are a subset of ophthalmologists, and pediatric optometrists are and subset of optometrists. Any eyecare provider is a subtotal variable where each provider is counted only once.
We then mapped provider place of service addresses to states and counties, and then divided by the resident population estimate for the location from the 2022 US Census population estimate. Rates are presented per 10,000 residents.
States with Child Vision Screening Legislation
The states with school screening legislation were compiled and provided by the National Center for Children’s Vision and Eye Health at Prevent Blindness.
References
- Rein, D.B., et al., The Economic Burden of Vision Loss and Blindness in the United States. Ophthalmology, 2022. 129(4): p. 369-378.
- Mavi, S., et al., The Impact of Hyperopia on Academic Performance Among Children: A Systematic Review. Asia Pac J Ophthalmol (Phila), 2022. 11(1): p. 36-51.
- Glewwe, P., K.L. West, and J. Lee, The Impact of Providing Vision Screening and Free Eyeglasses on Academic Outcomes: Evidence from a Randomized Trial in Title I Elementary Schools in Florida. J Policy Anal Manage, 2018. 37(2): p. 265-300.
- Neitzel, A.J., et al., Effect of a Randomized Interventional School-Based Vision Program on Academic Performance of Students in Grades 3 to 7: A Cluster Randomized Clinical Trial. JAMA Ophthalmol, 2021. 139(10): p. 1104-1114.
- Li, D., et al., Impact of Vision Impairment and Ocular Morbidity and Their Treatment on Quality of Life in Children: A Systematic Review. Ophthalmology, 2024. 131(2): p. 188-207.
- Manitsa, I., F. Barlow-Brown, and M. Livanou, Evaluating the role of social inclusion in the self-esteem and academic inclusion of adolescents with vision impairment. British Journal of Visual Impairment, 2023.
- Birch, E.E., et al., Self-perception of School-aged Children With Amblyopia and Its Association With Reading Speed and Motor Skills. JAMA Ophthalmol, 2019. 137(2): p. 167-174.
- Bui Quoc, E., et al., Amblyopia: A review of unmet needs, current treatment options, and emerging therapies. Surv Ophthalmol, 2023. 68(3): p. 507-525.
- Adomfeh, J., B.G. Jastrzembski, and I. Oke, Association of Race, Ethnicity, and Socioeconomic Status With Visual Impairment in Adolescent Children in the US. JAMA Ophthalmol, 2022. 140(10): p. 1006-1010.
- Besagar, S., et al., Association of Socioeconomic, Demographic, and Health Care Access Disparities With Severe Visual Impairment in the US. JAMA Ophthalmol, 2022. 140(12): p. 1219-1226.
- Mihalache, A., et al., Physical and Psychosocial Challenges as Predictors of Vision Difficulty in Children: A Nationally Representative Survey Analysis. Ophthalmic Epidemiol, 2024: p. 1-8.
- Mihalache, A., et al., Association Between Vision Difficulty and Sociodemographic Factors in Children: A Population-Based Analysis. Am J Ophthalmol, 2024. 257: p. 227-235.
- Moayad, L., et al., Association Between Sociodemographic Factors and Vision Difficulty in the National Health Interview Survey: A Population-Based Analysis. Am J Ophthalmol, 2023. 255:
p. 30-42. - Flaxman, A.D., et al., Prevalence of Visual Acuity Loss or Blindness in the US: A Bayesian Meta-analysis. JAMA Ophthalmol, 2021. 139(7): p. 717-723.
- Lundeen, E.A., et al., County-Level Variation in the Prevalence of Visual Acuity Loss or Blindness in the US. JAMA Ophthalmol, 2022. 140(8): p. 831-832.
- CMS. Monthly Medicaid & CHIP Application, Eligibility Determination, and Enrollment Reports & Data. November 2019; Available from: https://www.medicaid.gov/medicaid/national-medicaid-chip-program-information/medicaid-chip-enrollment-data/monthly-medicaid-chip-application-eligibility-determination-and-enrollment-reports-data/index.html.
- The Report
-
Over 600,000 children in the United States are living with uncorrectable visual acuity loss or blindness, and millions more experience vision problems from uncorrected acuity problems that could be easily resolved with glasses or contact lenses. In this report, we describe the case definitions, methods, and data sources used to create the Prevent Blindness Children’s Vision Health Map, the first ever online interactive system specifically designed to explore geographic variations in common children’s vision problems.
- Data Highlights
-
Key Findings from The Prevent Blindness Children’s Vision Health report:
*The Children’s Health Insurance Program (CHIP) provides health coverage to eligible children through both Medicaid and separate CHIP programs. Children eligible for CHIP are in families with incomes too high to qualify for Medicaid, but too low to afford private coverage. CHIP is managed by states according to federal requirements and is funded by states and the federal government.
- Using the Map
-
Using the Prevent Blindness Children’s Vision Health Map
This Prevent Blindness Children’s Vision Health Map provides a simple and intuitive way to explore the data presented in this report at the state or county level. This section demonstrates some of the key features and functionality of the map. Note that all of the outcome data included in the Children’s Vision Health Map are also available on the VEHSS website. However, VEHSS does not include bivariate relationship mapping.
Dropdown Menus
Use the dropdown menus on the left side of the map to make any changes in the selected geography, outcome measures, filters, indicators or relationships.
Note that you must click the Update Map button to load a new map with your selections.

Use this dropdown menu, then click Update Map to switch between State and County views.

Indicate States With Vision Screening Legislation
Use this dropdown, then click Update Map to add dots that will indicate which states have child vision screening legislation in 2024.

Filter By Subtopics
Use these dropdown menus to change the “base layer” data shown on the map.
Select Outcome Measure
The Outcome Measures are the main results of the Child Vision Health Map, including
- Vision Loss and Blindness which reports the prevalence of vision loss among all children in the United States,
- Amblyopia and Strabismus which reports diagnosis rates among children in Medicaid, and
- Vision Correction, which reports the proportion of children in Medicaid who received Medicaid-covered eyeglasses

Age Group, Race/Ethnicity, Gender
Selecting values in these dropdowns will filter the demographic groups displayed in the base- layer Outcome Measures. For example, if the selected outcome measure is ‘Any Visual Acuity Loss’, then selecting Age 0-11, Hispanic, and Male, then clicking ‘Update Map’ will reload the map showing the prevalence rates of ‘Any Visual Acuity Loss’ among 0–11 year-old Hispanic boys.

Add Relationship
What are the relationship variables?
The relationship variables are community (state or county) level data for factors that may be correlated with the outcome measures. An important point is that these variables are NOT measured among the children affected by the outcome measure – these are community level indicators measured among the entire population of the area. For example, Math Scores are a measure of the math scores for all students in the state or county. They are NOT the math scores among children with vision or eye problems. Currently, such data does not exist. The intent of the relationship variables is to facilitate users’ understanding of how community characteristics may be associated with vision and eye problems, diagnosis and treatment. The selection of these variables are based on expert opinion and published literature on social determinants of health and their associations with vision problems. Currently, there is little or no evidence on causal links between these variables and the vision and eye problems reported in this map.

Bivariate Map Mode
Selecting a relationship variable and clicking ‘Update Map’, will load the map in bivariate mode, which displays 2 variables each with its own color scale. The base layer is in blue, but the relationship variable is in orange. When both the base layer value and the relationship variable value are high, the blue and orange combine and turn green.
This image shows the bivariate map legend showing the combination of both color scales. In this example, the base layer is showing visual acuity loss in blue, where a darker blue indicates higher prevalence of visual acuity loss. The relationship variable selected is Math Scores shown in orange, where higher math scores are darker orange.

This image shows a small section of the map with these selections:
- The blue (1) counties in the west are areas with both high visual acuity loss prevalence and low math scores.
- The orange (2) counties in the east are areas where the prevalence of visual acuity loss is low and math scores are high.
- The green (3) county in the center has both high visual acuity loss and high math scores.
- The light orange (4), light blue (5), teal (6), and brown (7) counties are areas where one or both variables are above or below average.
- The dark gray (8) counties in the center are average in both visual acuity loss and math scores.
- The light gray (9) county in the south has low visual acuity loss and low math scores.

Please note: some colors on the map were changed for illustrative purposes. - Sources & References
-
Vision Loss
The vision loss prevalence estimates are from the CDC’s Vision and Eye Health Surveillance System’s ‘VEHSS Prevalence Estimates: Visual Acuity Loss’. The VEHSS Prevalence Estimates are generated using a statistical modeling approach called Bayesian meta-regression, which researchers used to combine information from multiple VEHSS data sources into a single summary estimate.
The ‘VEHSS Prevalence Estimates: Visual Acuity Loss’ use measured visual acuity data from the National Health and Nutrition Examination Survey (NHANES) as the reference point dataset to create output based on the characteristics and performance of the NHANES vision exam. In addition to NHANES, the estimation model used population-based study data to provide additional evidence, and self-reported survey data to provide information on variation by state, county, and among under-represented population groups.
Documentation
Explore the Data
All data included in the PUF file can be displayed and analyzed in the VEHSS Data Explorer interactive data visualization application.
Select ‘Vision Problems and Blindness’ > ‘Vision Loss and Blindness’ > ‘VEHSS Prevalence Estimate: Visual Acuity Loss’
Access the Data
All vision loss data presented in this report and on the Prevent Blindness Children’s Vision Health Map are from the VEHSS Prevalence Estimates public use file (PUF). This PUF is freely available for download from the CDC’s VEHSS Data Portal, which allows users to query, visualize, and access PUFs via download or through direct application programming interface (API).
Citations
Flaxman AD, Wittenborn JS, Robalik T, Gulia R, Gerzoff RB, Lundeen EA, Saaddine J, Rein DB. Prevalence of visual acuity loss or blindness in the US. JAMA Ophthalmology. 2021;139(7):171-23.
Lundeen EA, Flaxman AD, Wittenborn JS, et al. County-Level Variation in the Prevalence of Visual Acuity Loss or Blindness in the US. JAMA Ophthalmology. July 7, 2022: doi:10.1001/jamaophthalmol.2022.2405.Amblyopia, Strabismus, and Eyeglasses
Diagnosed prevalence of amblyopia and strabismus, and provision of eyeglasses measures included in the Prevent Blindness Children’s Vision Health Map come from CDC’s Vision and Eye Health Surveillance System (VEHSS) analysis of the Medicaid Transformed Medicaid Statistical Information System (T-MSIS) data. T-MSIS data are a set of de-identified person-level data files with information on enrollment, eligibility, service utilization, diagnoses, and payments in Medicaid and Children’s Health Insurance Program (CHIP). Owned by the Centers for Medicare & Medicaid Services (CMS), Medicaid data cover everyone enrolled in Medicaid and CHIP from participating states within a given year.
Certain beneficiaries were excluded from the analysis, including beneficiaries 1) who are dually enrolled in Medicare, 2) without a valid gender variable, 3) do not have a valid care plan variable, 4) are only enrolled in single-service plans (i.e., a dental plan), 5) have missing enrollment information, or 5) are duplicates based on beneficiary, plan, and state ID’s. Based on these exclusion criteria, 34,094,900 Medicaid/CHIP beneficiaries aged younger than 18 were included in the analysis.
Four states (Alabama, Alaska, Utah, and Vermont) were not included in the results because they were either not included in T-MSIS base file, or because data quality issues preclude them from the analysis.
Documentation
A summary of the VEHSS Medicaid data analysis
Explore the Data
All vision loss data presented in this report and on the Prevent Blindness Children’s Vision Health Map can be displayed and analyzed in the VEHSS Data Explorer interactive data visualization application.
Filter the data sources to ‘Medicaid’ to explore all vision and eye health indicators included in the VEHSS analysis of Medicaid data.
Access the Data
All vision loss data presented in this report and on the Prevent Blindness Children’s Vision Health Map are from the VEHSS Medicaid public use file (PUF).
This PUF is freely available for download from the CDC’s VEHSS Data Portal, which allows users to query, visualize, and access PUFs via download or through direct application programming interface (API).
Math and Reading Scores
The state and county-level Math Score and Reading Score data are from the Educational Opportunity Project at Stanford University. This project seeks to produce estimates of student performance that are comparable across states. The data are based on state testing from grades 3-8 by standardizing proficiency thresholds across different types of tests in different states.
Documentation
A summary of the SEDA data and methods
Explore the Data
The SEDA Educational Opportunity Explorer is an interactive online visualization application that can display the math score, reading score, and other data.
Access the Data
Public use files are available by request.
Citation
Reardon, S. F., Ho, A. D., Shear, B. R., Fahle, E. M., Kalogrides, D., Saliba, J. (2024). Stanford Education Data Archive (Version 5.0). Retrieved from https://purl.stanford.edu/cs829jn7849
Prevalence of Hearing Loss
The prevalence of hearing loss is based on data from NORC’s SoundCheck project. SoundCheck uses statistical modelling approaches to combine examination, survey, and administrative claims-based data to produce comprehensive estimates of the prevalence of hearing loss at the national, state and county level.
Documentation
Documentation is available through the SoundCheck ‘National Indicator Report on Hearing Loss’ report
Explore the Data
The soundcheckmap.org website contains an interactive map to display the hearing loss prevalence data.
Access the Data
Citation
Rein DB, Franco C, Reed NS, Herring-Nathan ER, Lamuda PA, Alfaro Hudak KM, Hu W, Hartzman AJ, White KR, Wittenborn JS. The prevalence of bilateral hearing loss in the United States in 2019: a small area estimation modelling approach for obtaining national, state, and county level estimates by demographic subgroup. Lancet Reg Health Am. 2024 Jan 24;30:100670. doi: 10.1016/j.lana.2023.100670.
Prevalence of cognitive difficulties, uninsured rate, poverty rate, low English-speaking proficiency, Income inequality
The prevalence of cognitive disabilities cognitive difficulties, uninsured rate, poverty rate, low English-speaking proficiency are based on 2022 American Community Survey (ACS) data.
• Cognitive difficulties are based on responses to the question: “Because of a physical, mental, or emotional problem, does the respondent have difficulty remembering, concentrating, or making decisions?” from table B18104 from 2022 ACS 5-year data.
• The Uninsured rate was calculated as the proportion of children in the location who were reported to lack health insurance, sourced from table B27001 from 2022 ACS 5-year data.
• The Poverty rate was calculated as the proportion of households in the location who reported annual household income below the poverty rate, sourced from table S1701 from 2022 ACS 5-year data.
• Low English-speaking proficiency was calculated as the percent of population who speak English less than “very well”. English proficiency data is sourced from table C16001 from 2022 ACS 5-year data.
• Income inequality is based on the GINI index, which is a coefficient value reported in table B19083 from 2022 ACS that summarizes the dispersion of household income, and ranges from 0 (perfect income equality) to 1 (perfect income inequality).
Eyecare Providers Per Capita
The eyecare providers per capita were calculated by analyzing the National Provider Index (NPI) produced by the National Plan and Provider Enumeration System (NPPES), part of the Centers for Medicare and Medicaid Services (CMS). The NPI contains the street address and provider type taxonomy codes for all healthcare providers who have registered to submit for reimbursement from CMS.
In our analysis, we used the provider type taxonomy codes to identify providers and categorize them into the following groups:
- Any eyecare provider
- Ophthalmologists
- Pediatric Ophthalmologists
- Optometrists
- Pediatric Optometrists
Of note, pediatric ophthalmologists are a subset of ophthalmologists, and pediatric optometrists are and subset of optometrists. Any eyecare provider is a subtotal variable where each provider is counted only once.
We then mapped provider place of service addresses to states and counties, and then divided by the resident population estimate for the location from the 2022 US Census population estimate. Rates are presented per 10,000 residents.
States with Child Vision Screening Legislation
The states with school screening legislation were compiled and provided by the National Center for Children’s Vision and Eye Health at Prevent Blindness.
References
- Rein, D.B., et al., The Economic Burden of Vision Loss and Blindness in the United States. Ophthalmology, 2022. 129(4): p. 369-378.
- Mavi, S., et al., The Impact of Hyperopia on Academic Performance Among Children: A Systematic Review. Asia Pac J Ophthalmol (Phila), 2022. 11(1): p. 36-51.
- Glewwe, P., K.L. West, and J. Lee, The Impact of Providing Vision Screening and Free Eyeglasses on Academic Outcomes: Evidence from a Randomized Trial in Title I Elementary Schools in Florida. J Policy Anal Manage, 2018. 37(2): p. 265-300.
- Neitzel, A.J., et al., Effect of a Randomized Interventional School-Based Vision Program on Academic Performance of Students in Grades 3 to 7: A Cluster Randomized Clinical Trial. JAMA Ophthalmol, 2021. 139(10): p. 1104-1114.
- Li, D., et al., Impact of Vision Impairment and Ocular Morbidity and Their Treatment on Quality of Life in Children: A Systematic Review. Ophthalmology, 2024. 131(2): p. 188-207.
- Manitsa, I., F. Barlow-Brown, and M. Livanou, Evaluating the role of social inclusion in the self-esteem and academic inclusion of adolescents with vision impairment. British Journal of Visual Impairment, 2023.
- Birch, E.E., et al., Self-perception of School-aged Children With Amblyopia and Its Association With Reading Speed and Motor Skills. JAMA Ophthalmol, 2019. 137(2): p. 167-174.
- Bui Quoc, E., et al., Amblyopia: A review of unmet needs, current treatment options, and emerging therapies. Surv Ophthalmol, 2023. 68(3): p. 507-525.
- Adomfeh, J., B.G. Jastrzembski, and I. Oke, Association of Race, Ethnicity, and Socioeconomic Status With Visual Impairment in Adolescent Children in the US. JAMA Ophthalmol, 2022. 140(10): p. 1006-1010.
- Besagar, S., et al., Association of Socioeconomic, Demographic, and Health Care Access Disparities With Severe Visual Impairment in the US. JAMA Ophthalmol, 2022. 140(12): p. 1219-1226.
- Mihalache, A., et al., Physical and Psychosocial Challenges as Predictors of Vision Difficulty in Children: A Nationally Representative Survey Analysis. Ophthalmic Epidemiol, 2024: p. 1-8.
- Mihalache, A., et al., Association Between Vision Difficulty and Sociodemographic Factors in Children: A Population-Based Analysis. Am J Ophthalmol, 2024. 257: p. 227-235.
- Moayad, L., et al., Association Between Sociodemographic Factors and Vision Difficulty in the National Health Interview Survey: A Population-Based Analysis. Am J Ophthalmol, 2023. 255:
p. 30-42. - Flaxman, A.D., et al., Prevalence of Visual Acuity Loss or Blindness in the US: A Bayesian Meta-analysis. JAMA Ophthalmol, 2021. 139(7): p. 717-723.
- Lundeen, E.A., et al., County-Level Variation in the Prevalence of Visual Acuity Loss or Blindness in the US. JAMA Ophthalmol, 2022. 140(8): p. 831-832.
- CMS. Monthly Medicaid & CHIP Application, Eligibility Determination, and Enrollment Reports & Data. November 2019; Available from: https://www.medicaid.gov/medicaid/national-medicaid-chip-program-information/medicaid-chip-enrollment-data/monthly-medicaid-chip-application-eligibility-determination-and-enrollment-reports-data/index.html.
